Remote patient monitoring Medicare programs run on outcomes. Health plans and provider groups want to know whether monitoring lowers blood pressure, prevents readmissions, and improves glycemic control in the populations they are accountable for. The published evidence answers those questions with specific numbers.
Medicare Advantage now covers most of the Medicare population, and the 2026 Star Ratings shifted weight away from patient experience and toward clinical outcome measures. Several of the heaviest-weighted measures are exactly what a well-run monitoring program moves.
This guide covers what remote monitoring changes clinically, how those changes map to payer quality measures, what the total cost of care evidence shows, and where coverage and reimbursement fit.
What Remote Patient Monitoring Delivers Under Medicare
Remote patient monitoring collects physiologic data from a patient at home and routes it to a care team for review. Under Medicare, it is a clinical service rather than a technology purchase.
The value comes from shortening the feedback loop. A patient managing hypertension between quarterly visits normally produces one reading every three months. With a connected monitor, that same patient produces daily readings, and a clinician sees a rising trend in week two rather than at the next appointment.
That earlier visibility is where the outcomes come from. It also produces something payers need, which is a documented, measurable record of chronic disease control across a population.
The Evidence: What Remote Monitoring Changes Clinically
Blood Pressure Control
Hypertension is the most studied application, and the effect sizes are consistent.
A meta-analysis of 32 high-quality studies found that remote blood pressure monitoring reduced systolic pressure by 4.46 mmHg and diastolic pressure by 2.08 mmHg compared with usual care. The blood pressure control rate was higher in the monitored group, with a relative ratio of 1.226.
Programs that pair monitoring with scheduled clinical follow-up do better. A meta-analysis of 13 randomized controlled trials covering 3,969 participants found a mean systolic reduction of 7.35 mmHg with pharmacist-led remote follow-up. Scheduled follow-up produced an 8.89 mmHg reduction. As-needed follow-up produced only 3.23 mmHg.
Real-world cohort data is stronger still. A large retrospective analysis found systolic pressure improved by 7.3 mmHg across all patients and 16.7 mmHg among patients with stage 2 hypertension, after an average of 289 days on the program.
Context for those figures: a 5 mmHg reduction in systolic pressure is associated with roughly a 10% decrease in serious cardiovascular events. The differences above are clinically material, not marginal.
Readmissions and Hospitalizations
Post-discharge is the window where monitoring has the clearest utilization effect.
A prospective cohort study in JMIR Formative Research found significantly fewer hospital readmissions among high-risk patients after discharge when remote monitoring was in place. A separate retrospective cohort study of a Medicare remote care program reported a 27% reduction in hospital readmissions relative to eligible non-enrolled controls.
Condition-specific results can be larger. In a study of 126 COPD patients in an outpatient pulmonary practice, all-cause hospitalizations fell 65%, from 137 admissions to 48. Cardiopulmonary admissions fell 63.6%. Early identification of exacerbations was the mechanism.
Glycemic Control
Research published in the World Journal of Diabetes found that telemedicine-supported monitoring improved HbA1c and glycemic control in patients with type 2 diabetes, along with quality-of-life scores.
A review in the Journal of Diabetes Science and Technology found the largest A1C effects in programs that incorporated more elements of structured self-monitoring. Structure outperforms volume. A program with defined testing schedules and a clear clinical response beats one that simply collects readings.
Where Medicare Coverage Sits Today
Understanding the payer mix matters, because fee-for-service and Medicare Advantage evaluate monitoring differently.
Medicare Advantage now covers 55% of the eligible Medicare population, up from 19% in 2007, according to KFF. Enrollment grew by roughly 1.1 million beneficiaries between 2025 and 2026. The Congressional Budget Office projects the share will reach 63% by 2034.
Special needs plans are the fastest-growing segment, at 23% of total Medicare Advantage enrollment in 2026. Chronic condition special needs plans, or C-SNPs, grew 45% between 2025 and 2026. These plans enroll members selected specifically for chronic disease, which makes them the most direct fit for a monitoring program.
The distinction is practical. Under fee-for-service, monitoring is a billable service with defined codes. Under Medicare Advantage and value-based arrangements, the plan carries risk for total cost of care and is scored on quality measures. In that setting, the argument for monitoring is avoided utilization and quality performance, not claims revenue.
How Remote Monitoring Maps to Star Ratings Measures
The 2026 Star Ratings made a structural change worth noting. CMS cut the weight on patient experience, complaints, and access measures from 4 to 2, moving emphasis toward clinical outcomes. The 2026 methodology uses 45 measures with a total weighted value of 81 stars.
Three of the heaviest-weighted outcome measures line up directly with what a monitoring program produces.
| 2026 Star Ratings measure | Weight | How monitoring contributes |
|---|---|---|
| Controlling Blood Pressure | 3 | Daily readings plus titration support move members into range and document it |
| Diabetes Care, Blood Sugar Controlled | 3 | Structured glucose monitoring with clinical response improves A1C |
| Plan All-Cause Readmissions | 3 | Post-discharge monitoring catches deterioration before readmission |
| Kidney Health Evaluation for Patients with Diabetes | New for 2026 | Monitored diabetic members are already in a review cadence that supports screening |
Plan All-Cause Readmissions has been among the weaker-performing measures across plans, which makes it a practical target. Controlling Blood Pressure has been among the better-performing measures, so the opportunity there is protecting a score rather than rescuing one.
Provider organizations see the same measures through HEDIS, since the underlying specifications overlap. A monitoring program that captures readings consistently produces the numerator evidence both scorecards require.
For a fuller treatment of how plans evaluate these programs, see our overview of payer solutions in remote patient monitoring.
Total Cost of Care and Program Economics
Cost reduction in monitoring follows from avoided harm. A member who does not have a hypertensive crisis does not have an emergency department visit. The savings are a byproduct of the clinical result, which is the right order to think about it in.
The published figures are specific. A retrospective cohort study of Medicare patients with chronic disease found average total savings of $1,302 per patient per year versus eligible non-enrolled controls, inclusive of the cost of the monitoring program itself. That study also reported the 27% readmission reduction cited above.
Reported return on investment varies with population risk and program design. A health plan telemonitoring case study estimated roughly 3.3 times return, or $3.30 in avoided cost for every $1 spent. Programs targeting higher-acuity members generally see larger absolute savings, because there is more avoidable utilization to prevent.
Two design factors drive whether those numbers hold:
- Population selection. Savings concentrate in members with uncontrolled disease or recent admissions. Enrolling well-controlled members produces good adherence data and little cost offset.
- Adherence infrastructure. A program only generates outcomes if members keep taking readings. Cellular devices that need no app, no Wi-Fi, and no smartphone remove the most common reasons members stop.
Who Qualifies for Remote Patient Monitoring Through Medicare
Coverage under fee-for-service Medicare requires all of the following. Medicare Advantage plans generally follow these rules and may add their own criteria, so confirm with each plan.
- The member has a chronic or acute condition under active management.
- There is an established patient-provider relationship.
- The device is FDA-cleared for its intended use.
- The device transmits data automatically rather than relying on self-report.
- Data is collected for the minimum days required by the code billed.
- The member consents and is informed of any cost sharing.
Reimbursement in Brief
Fee-for-service Medicare pays for monitoring through a small set of CPT codes covering device setup, device supply, and monthly treatment management. The CY 2026 Physician Fee Schedule added two codes, 99445 and 99470, which cover shorter monitoring periods and lower-intensity management. Both took effect January 1, 2026.
The practical effect is wider eligibility. A member who records 12 readings in a month, or a nurse who spends 14 minutes reviewing them, now falls inside the billable range. That helps during the first weeks of enrollment, when a reading habit is still forming.
Federally qualified health centers and rural health clinics saw a larger change. HCPCS G0511 was terminated effective January 1, 2026, and these sites now bill the standard care management CPT codes at the national non-facility rate. For most sites this raises reimbursement per member, and it requires more granular tracking of days and minutes.
Confirm current rates against the Medicare Physician Fee Schedule, since payment changes annually and varies by locality. HHS also publishes guidance on billing Medicare for remote patient monitoring.
Chronic Conditions Common Among Medicare Beneficiaries
Roughly two thirds of Medicare beneficiaries manage three or more chronic conditions. The most common are conditions that respond to daily measurement.
- Hypertension, monitored with a connected blood pressure device
- Type 2 diabetes, monitored with a cellular glucometer
- Heart failure, monitored by weight for fluid retention
- COPD and asthma, monitored by pulse oximetry or peak flow
- Chronic kidney disease, often alongside diabetes and hypertension
Among adults 65 and older, 28.8% have diabetes and 52.1% have prediabetes, per the CDC National Diabetes Statistics Report. The overlap between these conditions and the weight-3 Star Ratings measures is not coincidental. CMS weighted the measures that reflect where the population’s risk sits.
Building a Program That Produces Reportable Outcomes
Select the Population Deliberately
Start with members who have uncontrolled disease, a recent admission, or a gap in a quality measure. This is where both the clinical benefit and the cost offset concentrate.
Match the Measure to the Device
If the target is Controlling Blood Pressure, the device is a blood pressure monitor and the cadence is daily. Decide which measure the program is meant to move before selecting hardware.
Remove Technical Barriers
Adherence collapses when setup depends on a smartphone, an app, or home Wi-Fi. Cellular devices that arrive pre-paired and work from a power outlet keep older members in the program.
Define the Clinical Response
The evidence is clear that scheduled follow-up outperforms as-needed follow-up by a wide margin. Set thresholds, assign ownership, and schedule review rather than waiting for an alert to prompt action.
Instrument the Reporting
Capture readings, clinical time, and outcome changes in a form that feeds quality reporting. A program that improves control but cannot document it will not move a Star Rating.
Frequently Asked Questions
1) Does remote patient monitoring improve outcomes for Medicare patients?
Yes. Meta-analyses show systolic blood pressure reductions of roughly 4 to 7 mmHg versus usual care, with larger effects when follow-up is scheduled. Studies also show reduced readmissions and improved HbA1c in type 2 diabetes.
2) Which Star Ratings measures does remote monitoring affect?
It maps most directly to Controlling Blood Pressure, Diabetes Care Blood Sugar Controlled, and Plan All-Cause Readmissions, each weighted 3 in the 2026 methodology. It also supports the new Kidney Health Evaluation for Patients with Diabetes measure.
3) How do Medicare Advantage plans evaluate remote monitoring?
Plans generally assess it on quality measure performance and total cost of care rather than claims revenue, because they carry risk for member spending. Avoided admissions and documented disease control are the relevant outputs.
4) What cost savings has remote monitoring produced for Medicare populations?
A retrospective cohort study of Medicare patients with chronic disease found average savings of $1,302 per patient per year against eligible non-enrolled controls, inclusive of program cost. Results vary with population acuity and program design.
5) Does Medicare cover remote patient monitoring?
Yes. Coverage requires a chronic or acute condition under management, an established patient-provider relationship, an FDA-cleared device that transmits automatically, the minimum days of readings, and member consent.
6) Do members need Wi-Fi or a smartphone?
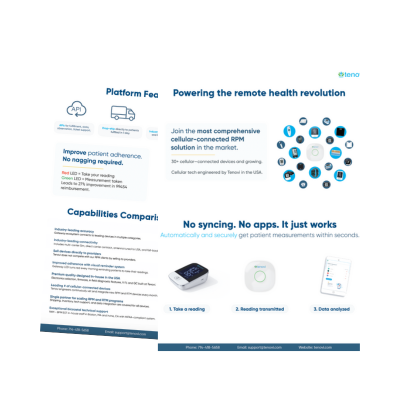
Not with cellular devices. Tenovi devices transmit through the Tenovi Cellular Gateway, which the member plugs into a power outlet. There is no app, no account setup, and no Wi-Fi configuration.
7) Which members should a plan enroll first?
Members with uncontrolled hypertension or diabetes, members with a recent admission, and members who represent an open gap in a weighted quality measure. Savings and quality gains concentrate in these groups.
8) Can FQHCs and RHCs still bill G0511?
No. G0511 was terminated effective January 1, 2026. These sites now bill the standard care management CPT codes at the national non-facility rate, which generally increases reimbursement per member.
Understanding Remote Patient Monitoring and Medicare
Remote patient monitoring Medicare programs stand on outcomes evidence that has grown specific enough to plan against. Systolic reductions of 4 to 7 mmHg against usual care, larger reductions among stage 2 hypertension patients, a 27% drop in readmissions, and improved HbA1c in type 2 diabetes are the results published programs report. Scheduled clinical follow-up roughly doubles the blood pressure effect compared with responding only when an alert fires.
Those results now sit against a payer landscape that rewards them. Medicare Advantage covers 55% of eligible beneficiaries, chronic condition special needs plans grew 45% in a year, and the 2026 Star Ratings shifted weight toward clinical outcome measures. Controlling Blood Pressure, Diabetes Care Blood Sugar Controlled, and Plan All-Cause Readmissions each carry a weight of 3, and each is measurably affected by consistent home monitoring with a defined clinical response. The cost evidence follows the clinical evidence, with published savings of $1,302 per patient per year inclusive of program cost.
The operational requirements are consistent across every study that produced good numbers. Select members who have room to improve. Remove the technical barriers that stop older adults from taking readings. Schedule the clinical response rather than waiting on alerts. Capture the data in a form quality reporting can use.
Tenovi supplies FDA-cleared connected devices that transmit automatically through the Tenovi Cellular Gateway, with no app, no Wi-Fi, and no smartphone required. Fulfillment, member technical support, and a single API into your platform come with it. More than 300 RPM companies work with Tenovi, with over 500,000 devices deployed. Book a free demo and consultation to see how Tenovi supports a Medicare monitoring program built around reportable outcomes.